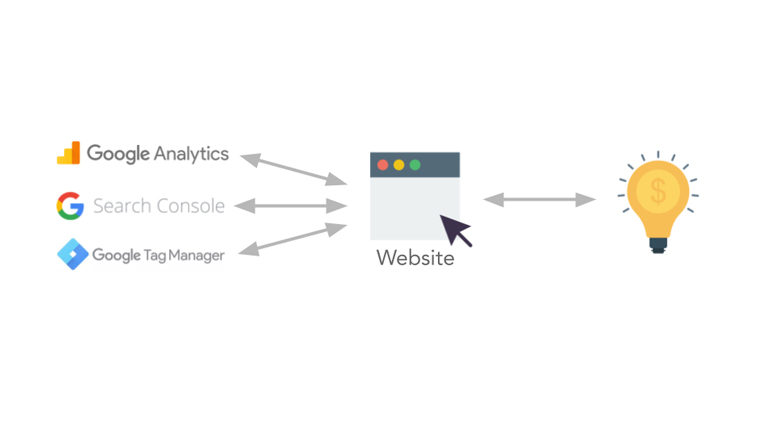
In this article, I’ll walk you through how to take data from Google Analytics, Google Search Console and Google Tag Manager, combine them together so you can make better decisions to grow your company.
Google Analytics is a data collection tool that helps you understand what people are doing on your website. The data it provides can help you make better decisions on how to improve your website and your marketing strategy.
Google Search Console is like Google Analytics, but it is more geared towards providing you with organic search data. It can also report issues and errors to you that could be limiting your website’s ability to show up in search.
Google Tag Manager is a bit different compared to the others: think of it as the glue that you can use to bring all these scripts and tags together. Marketing scripts such as Google Analytics, Facebook Pixel, Google Remarketing, LinkedIn Insights can be added into your website through Google Tag Manager.
You can also control and manipulate where you want these scripts to appear on your website, and how you want them to behave all with Google Tag Manager.
Hopefully, this sounds all good to you so far. But why should you care?
We live in a world full of information.
We live in a world of data, which is particularly true in the fields of online advertising and marketing.
Data is useless unless you can convert the data into actionable insights that turn into results which grow your company.
This is what this article is about – it’s not about the tools; it’s about how you can use these tools to grow your company.
Like I said, all of these tools are absolutely useless if they’re not calibrated to achieve your greater business growth goals.
This is the most important thing to get right when it comes to data & analytics.
There are three key questions that you should answer before setting up these tools, regardless of the stage you are at with your business.
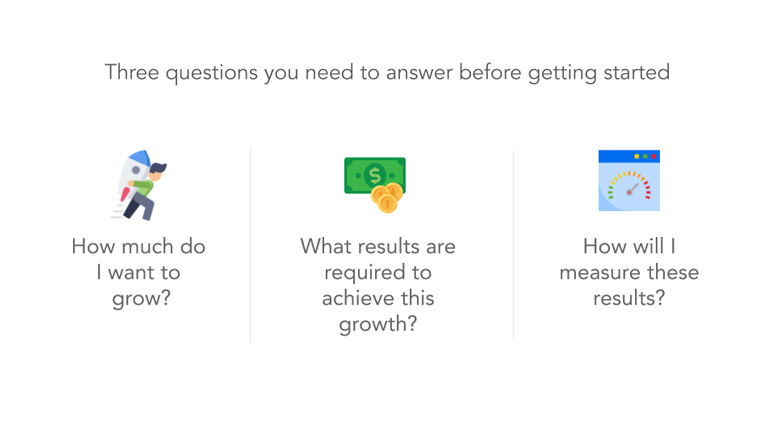
Question one: How much do I want to grow?
Question two: What are the results required to achieve this growth?
Question three: How can I measure these results so I can get the data I need to evolve my online strategy and my greater business strategy?
How should you go about answering these questions? Well, this is how we do it at Web3.
First, we conduct an online opportunity analysis.
Second, we create an online KPI roadmap. There’s no point in doing all this online work if we don’t have goals, objectives and targets to align the work with meaningful outcomes.
These are the two most important things to get right before you get started with these platforms.
Let’s break down what an opportunity analysis actually is.
I’ll use an example of a business called ‘Acme Corp’ to help explain this.
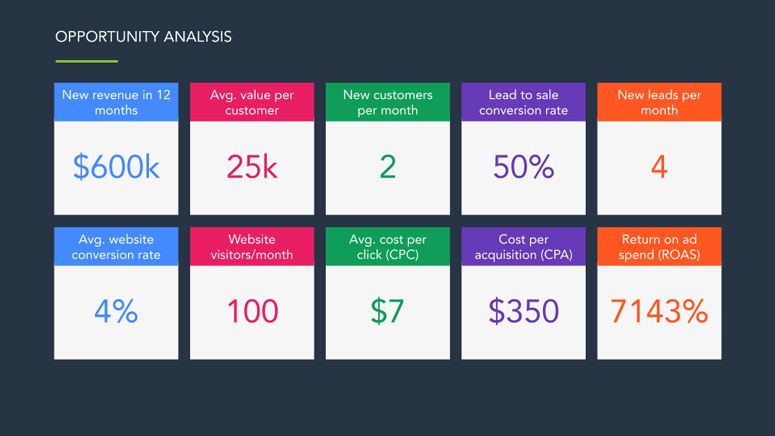
1. In the next twelve months, I want to increase new revenue at Acme Corp by $600k.
2. I know the average customer value for Acme Corp is around $25k.
3. That means I’m going to need two new customers per month for the next twelve months at $25k in value each to hit that $600k new revenue growth goal.
4. I know that Acme Corp’s sales team has a lead to sale conversion rate is 50%. So that means one out of every two leads convert into a paying customer.
5. That means I need four new leads per month and convert half of them to get my new target customer volume per month.
6. I know that my average website conversion rate is at 4%.
7. That means I’m going to at least need 100 new visitors to my website every month if I want to convert 4 out of the 100 into new leads.
8. If you ever consider things like paid advertising, you can use tools like Google and Facebook and even LinkedIn to give you average cost per click (CPC) figures based upon the ad sets. Let’s say the average CPC for Acme Corp is $7.
9. That means my cost per acquisition (CPA) is $350 per acquisition.
10. That means my return on advertising spent, if I hit all of these numbers, is 7143%.
Not bad right? But the biggest mistake I see businesses do is they dive into paid advertising and throw money around everywhere without thinking about how they are going to get a return.
TThey haven’t actually taken a step back to think about what are the goals and targets that need to hit for this to be a profitable growth exercise for the business.
And that’s why conducting an online opportunity analysis matters.
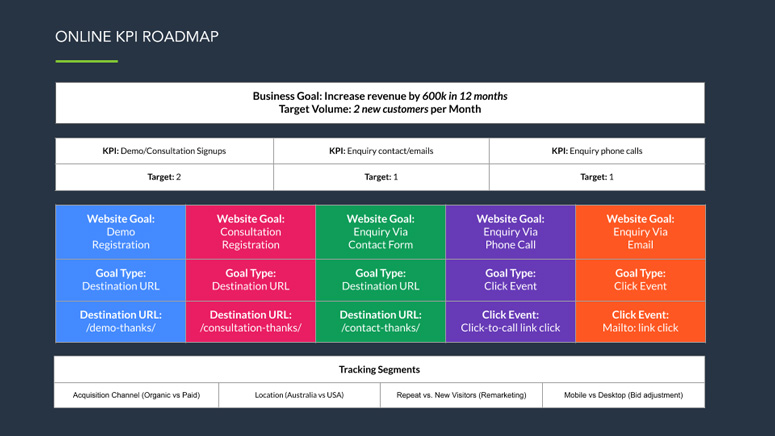
Let’s move onto the online KPI road map.
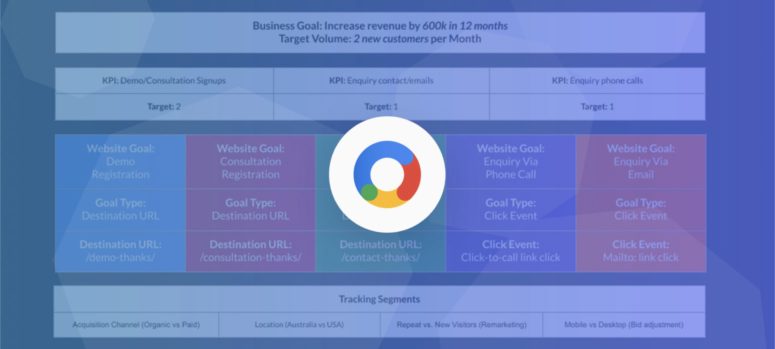
1. The business goal is to increase Acme Corp’s revenue by 600k in 12 months.
2. Our target volume to achieve this is 2 customers per month at the $25k average lifetime value per customer.
3. Acme Corp has an offline sales process, meaning that the sale is made offline through demo consultation meetings.
4. Acme Corp is going to need to get four leads per month, leading to at least two consultation meetings where the sale will be conducted.
5. Aside from website enquiries, Acme Corp gets potential customers calling them from their phone number on their website, which leads to demo consultation bookings.
6. Additionally, Acme Corp gets a couple of enquiries per month directly from the email address listed on their website.
Now we have an understanding as to the KPIs Acme Corp’s website needs to achieve for it to fulfil the greater business growth goal.
Next, we start looking at how we build in the conversion tracking layer.
First, let’s look at demo consultation registrations. Acme Corp’s website allows people to sign up for a demo.
In this case, you should attribute those demo signups as a goal conversion inside Google Analytics. Once the potential customer has booked in their demo consultation, they are redirected to a thank you page with a unique URL. You can then set a destination conversion tracking goal on this new URL and attribute users that land on this URL as a demo consolation conversion.
The website also has a free strategy session offer which leads to a demo consultation.
We would want to track these free strategy session conversions on the website and attribute the conversions towards the lead KPI.
Same with the enquiry phone calls – website click to call numbers can be tracked. They’re not as good as if using dynamic phone tracking numbers, which means a dynamic number is loaded on the ad group and on the website when the user sees the ad or lands on the webpage.
You can then attribute that phone call to the ad group and even to the keyword that generated the phone call. Although it is a bit more advanced to set up, that’s the more accurate way to track phone call enquiries.
The enquiry email is if you have a mailto link on your website where someone clicks on it to open up their email app so they can send you an email enquiry.
You can use event tracking in Google Analytics and Google Tag Manager to track these conversion clicks.
Another thing you might want to consider is also your segmentation. This is more for reporting on the data, and how you can slice and dice the data to give you the information you want.
Let’s say your website ranks well in organic search and you want to compare your organic search acquisitions against your paid acquisitions.
Or, you have a global business with customers primarily in the United States & Australia.
In that case, you would want to view acquisitions by country.
How about new visitors versus repeat visitors?
More specifically, how many times your visitors came back to your website before they actually converted?
Another one we like to set up is mobile vs. desktop conversions. That way, you can adjust your advertising budget distribution down to the types of devices that are generating the best conversions.
You can pick and choose the ones that make the most sense for your business, however, we usually go with these as a base to start off on our reporting.
How do you go about setting up and using these tools in your business? Let me know in the comments below!

